

How to Set Up LoRaWAN Energy Monitoring Systems
I start a LoRaWAN energy monitoring setup with the readings I need – not the gateway. Choose pulse output for energy totals, Modbus for more meter readings, or CT-based metering with a voltage reference for accurate energy measurements.
Here’s the setup path I follow:
- Match the hardware: Check voltage, phase, CT inputs, accuracy, US915 support, and total costs.
- Install and connect: Use qualified electrical personnel for panel work, test radio coverage, and connect devices through the gateway and network server to the dashboard.
- Check the data: Verify decoding, units, timestamps, and scaling. A 15-minute reporting interval does not guarantee a 15-minute demand calculation.
- Test before expanding: Compare readings with a source meter or calibrated reference over 24–72 hours, then set alerts, secure credentials, and document who handles support.
My go/no-go rule: <u>verify both meter accuracy and data delivery before adding more devices.</u>
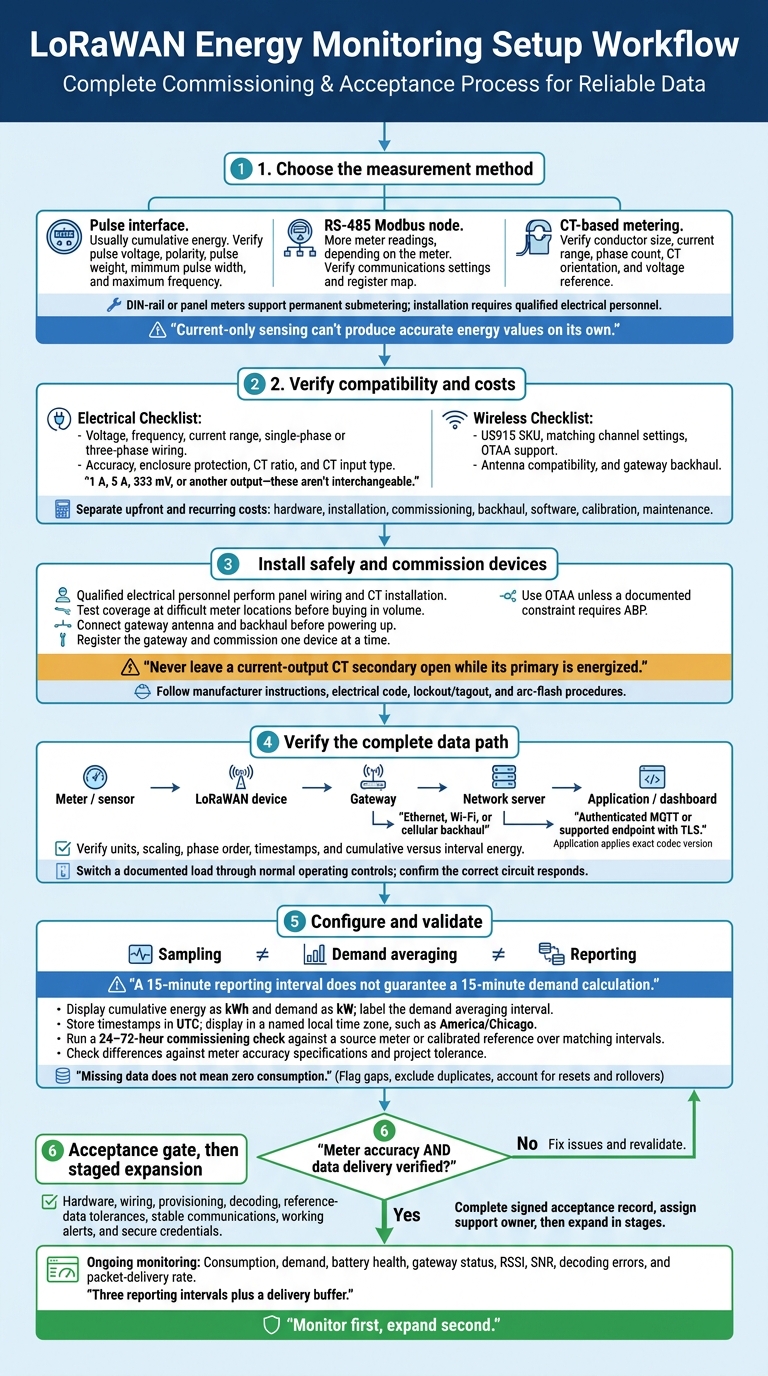
LoRaWAN Energy Monitoring Setup: From Meter Selection to Expansion
Getting started with LoRaWAN
sbb-itb-0e600ab
Step 1: Choose Compatible Meters, Sensors, and Gateways
Use the site sheet from the planning step to pair each monitoring point with the right meter, sensor, and gateway. Review LoRaWAN energy devices on CHOOVIO and request the data sheet for the exact model. Check electrical compatibility separately from wireless compatibility. Before approving a device, match its nominal voltage, frequency, current range, single-phase or three-phase wiring, accuracy, and enclosure protection to the site’s needs.
Choose a Measurement Method
Match the measurement method to what you need to monitor:
| Method | Installation requirements | Measurements | Suitable uses |
|---|---|---|---|
| Pulse interface | Connect to a pulse-output meter. Verify pulse voltage, polarity, pulse weight, minimum pulse width, and maximum frequency. | Usually cumulative energy; resolution depends on the meter’s pulses per kilowatt-hour. | Retrofitting existing meters and monitoring utility consumption. |
| RS-485 Modbus node | Wire to the meter and set the slave address, baud rate, parity, stop bits, and register map. | Voltage, current, power, power factor, frequency, and cumulative energy, depending on the meter. | Detailed equipment, building, and submeter monitoring. |
| Clamp-based sensor | Install current transformers around conductors. Verify conductor size, current range, phase count, and CT orientation. | Current and sometimes calculated power or energy; resolution and accuracy depend on the CT and reference-voltage method. | Nonintrusive monitoring of feeders, motors, HVAC circuits, and branch panels. |
| DIN-rail or panel meter | Have qualified electrical personnel install the meter inside an appropriately rated electrical enclosure. Connect voltage and current inputs as specified. | Often voltage, current, real power, reactive power, power factor, and kilowatt-hours. | Permanent submetering and higher-quality electrical measurements. |
After choosing a method, check CT input requirements and metering accuracy. Confirm whether the inputs require 1 A, 5 A, 333 mV, or another output – these aren’t interchangeable. Check the CT ratio, insulation rating, and accuracy across the expected load range. For accurate kWh reporting, use voltage-and-current metering or a validated voltage reference. Current-only sensing can’t produce accurate energy values on its own.
Check US915 Support and Project Costs
Once electrical compatibility is confirmed, check radio support and gateway backhaul. Require the US915 SKU, matching channel settings, and OTAA support across the device, gateway, and network server. Check the antenna band, connector compatibility, gain, cable length, and mounting-site conditions. Request the FCC ID, too. Keep these radio checks separate from electrical safety checks: FCC authorization doesn’t establish metering accuracy or panel safety.
Match gateway backhaul to the available Ethernet, Wi-Fi, or cellular service. Test coverage at difficult meter locations before buying in volume. For both sensors and gateways, check enclosure protection and operating limits in °F.
Request the full payload specification, a payload decoder, register map, measurement resolution, accuracy statement, maximum payload size, encoding format, and firmware-update method. Assess battery-life claims against your planned reporting interval, payload size, radio conditions, temperature, and downlink activity – not just the advertised maximum.
Request an itemized quote in U.S. dollars covering hardware, installation, commissioning, backhaul, software, calibration, and maintenance. Keep upfront and recurring costs separate. Pricing and battery life depend on the hardware and installation.
Step 2: Install Hardware and Set Up the LoRaWAN Network
With compatible hardware selected, install it and bring the network online in the sequence below.
Mount the Gateway and Connect Meters Safely
Mount the gateway in a central, elevated spot that’s easy to access and has clear paths to the meters. Keep the antenna outside metal cabinets. Connect the antenna and backhaul before powering up, and follow the manufacturer’s grounding and surge-protection instructions. Check power and backhaul before final mounting. Record the location, mounting height, antenna model, cable length, backhaul type, gateway identifier, and serial number.
Have a qualified electrician wire the meters and CTs, following U.S. electrical code, lockout/tagout, and arc-flash procedures. De-energize the circuit, verify that no voltage is present, and wear the required PPE. Follow the manufacturer’s instructions for CT orientation and phase assignments. Never leave a current-output CT secondary open while its primary is energized. Use an approved shorting block before disconnecting CT wiring. Record meter and sensor serial numbers, panel/circuit IDs, CT ratios, the phase map, and the installation date in MM/DD/YYYY format.
With the hardware mounted and wired, register the gateway and commission devices one at a time.
Register the Gateway and Add Devices with OTAA
Register the gateway identifier in the network server. Apply the approved US915 channel plan to the gateway, server, and devices. Create device profiles with the correct LoRaWAN version, Regional Parameters revision, device class, payload limits, and codec. Keep each DevEUI, JoinEUI/AppEUI, and root key in secure credential storage – not shared spreadsheets. Use OTAA unless a documented constraint requires ABP.
Commission one device at a time. Check that the gateway is online, the expected DevEUI joins, and later uplinks arrive. Save the join time, packet timestamps, frame counters, RSSI, and signal-to-noise ratio. If a device won’t join, check channel settings, identifiers, keys, and antenna connections before adding more devices. Match each DevEUI to its meter, panel, and circuit record before moving to the next device.
Once uplinks arrive reliably, check delivery to the application.
Send Meter Readings to the Application
Configure authenticated MQTT or the supported endpoint with TLS and separate, least-privilege credentials. Check the endpoint, topics, certificates, and reconnect behavior.
Apply the exact codec version. Compare decoded readings with the meter display to verify units, scaling, phase order, and cumulative versus interval energy. Check any battery, tamper, or fault fields, too. Assign building, panel, circuit, and tenant labels in the application. Don’t assume the gateway decodes or aggregates readings.
Switch a documented load through its normal operating controls. Confirm that the assigned circuit – not an unrelated one – shows the change. Once end-to-end delivery is confirmed, tune reporting intervals and validate accuracy.
Step 3: Configure Readings and Verify System Performance
Once end-to-end delivery is confirmed, adjust reporting settings and check that the application’s values match the meter.
Set Reporting Intervals and Measurement Scales
Treat sampling, demand averaging, and reporting as separate settings. A meter may sample frequently and calculate demand over a fixed interval, while the LoRaWAN device sends cumulative energy readings less often. Choose the reporting interval based on the site’s needs, battery budget, gateway capacity, and network airtime. Use unconfirmed uplinks for routine readings. Confirmed messages and retransmissions use more airtime, so save them for cases where acknowledgment matters.
Document the meter’s unit, scale factor, register size, byte order, signedness, decimal precision, and reset behavior. Depending on the meter type, also record the pulse weight, register map, or CT ratios and phase map. Check whether scaling has already been applied so you don’t apply it twice.
Display cumulative energy as kWh and demand as kW, and include the demand averaging interval in the label. Keep raw values, timestamps, integration intervals, transmitted values, and reset or rollover rules. Store timestamps in UTC, then convert them to a named local time zone, such as America/Chicago, for display and daylight saving time handling.
Check Accuracy and Fix Data Problems
Run a 24- to 72-hour commissioning check. Compare starting and ending cumulative readings with the source meter or a calibrated reference over matching intervals. Check any differences against the meter’s accuracy specification and the project tolerance. Review polarity, phase mapping, scaling, register selection, and elapsed time.
Before using the readings for billing or other regulated purposes, verify the meter’s accuracy certification and the applicable state, local, utility, and contractual requirements.
| Symptoms | Likely causes | Configuration checks | Corrective actions |
|---|---|---|---|
| Missing uplinks | Device power loss, poor coverage, gateway or network outage, airtime limits, or payload errors | Check battery or supply voltage, gateway status, reporting interval, payload decoder, frame counters, and last-seen time | Restore power, correct the decoder, improve antenna placement, reduce payload size or reporting frequency, and verify gateway connectivity |
| Incorrect totals | Wrong pulse weight, multiplier, CT ratio, register, byte order, phase mapping, signedness, or counter reset | Compare raw payloads with the meter display and register map; inspect timestamps and counter continuity | Correct scaling and phase settings, handle resets or rollovers, exclude duplicates from aggregation, and revalidate over a known interval |
| Weak or unstable signals | Excessive distance, obstruction, poor antenna placement, interference, or unsuitable data rate | Review RSSI, SNR, data rate, and packet-delivery rate trends | Improve antenna placement or coverage; use ADR only where conditions are stable enough for the network to optimize it |
After the commissioning check passes, lock in the rules for gaps, duplicates, and resets.
Missing data does not mean zero consumption. Exclude duplicates from totals, but keep audit records. Flag gaps and implausible spikes instead of silently deleting them. Use the next valid cumulative value to recover energy across missed uplinks. Calculate differences over the actual elapsed time, accounting for documented resets, rollovers, and replacements.
Track Device Health and Plan Network Growth
Once accuracy is stable, focus on device health monitoring and capacity planning. Monitor first, expand second.
Set alerts for abnormal consumption, excessive demand, low batteries, gateway outages, and readings that remain missing after three reporting intervals plus a delivery buffer. Track RSSI, SNR, decoding errors, and packet-delivery rate alongside energy data.
Keep an access-controlled inventory of device IDs, locations, firmware versions, keys, and configuration parameters. Revalidate after changes to CTs, meter configuration, the decoder, firmware, antenna, gateway, or reporting interval.
Before adding devices, assess coverage, payload size, airtime, reporting frequency, and capacity. Add devices in stages, comparing delivery performance before and after each addition.
Conclusion: Check Readiness Before Expanding
After commissioning and verification, complete a documented go/no-go check before expanding. Confirm that the system meets its original monitoring goals. Check each point’s location, meter ID, unit, interval, owner, and accuracy band.
Create a signed acceptance record confirming that hardware, wiring, provisioning, and decoding pass all acceptance checks. Verify that baseline kWh and kW readings include timestamps in the site’s local time zone, and that energy totals and demand calculations fall within reference-data tolerances.
Once the system passes acceptance, assign an owner for continued support to keep monitoring reliable. Confirm that communications are stable, alerts reach the right people, and credentials are kept in a secured secrets store. Record test dates, results, exceptions, and fixes.
Before ordering more hardware, check CHOOVIO for current specifications and availability. Expand in stages, approving the next batch only after the acceptance record is complete.
FAQs
How many gateways does my building need?
For many buildings, one gateway is enough, covering up to 6,560 feet and handling hundreds of sensors at once. The number of gateways needed depends on the building’s size, sensor density, and layout. Buildings with multiple floors or structural barriers may need one gateway per floor or zone to maintain reliable connections.
CHOOVIO recommends a site-specific assessment or contacting our team to find the right setup for consistent monitoring and better energy efficiency.
Can I recover readings after an internet outage?
Recovery depends on your hardware and network setup. Standard LoRaWAN sensors typically send real-time readings, which may be lost during an outage. Some devices, such as the CTH01 power monitor, include onboard storage to retain readings.
To keep data available long term, save it in a persistent, third-party database such as InfluxDB. Keep device configuration snapshots so you can quickly restore settings after outages or repairs.
How do I calculate savings from my energy data?
Start by using detailed data from your LoRaWAN sensors to set an energy-use baseline. Monitor circuits in real time to spot wasted energy, power used while equipment sits idle, and spikes outside business hours.
Then make targeted changes, like adjusting equipment schedules or HVAC settings. Compare your updated consumption data with your baseline or past utility bills to measure reductions in energy use and costs.
